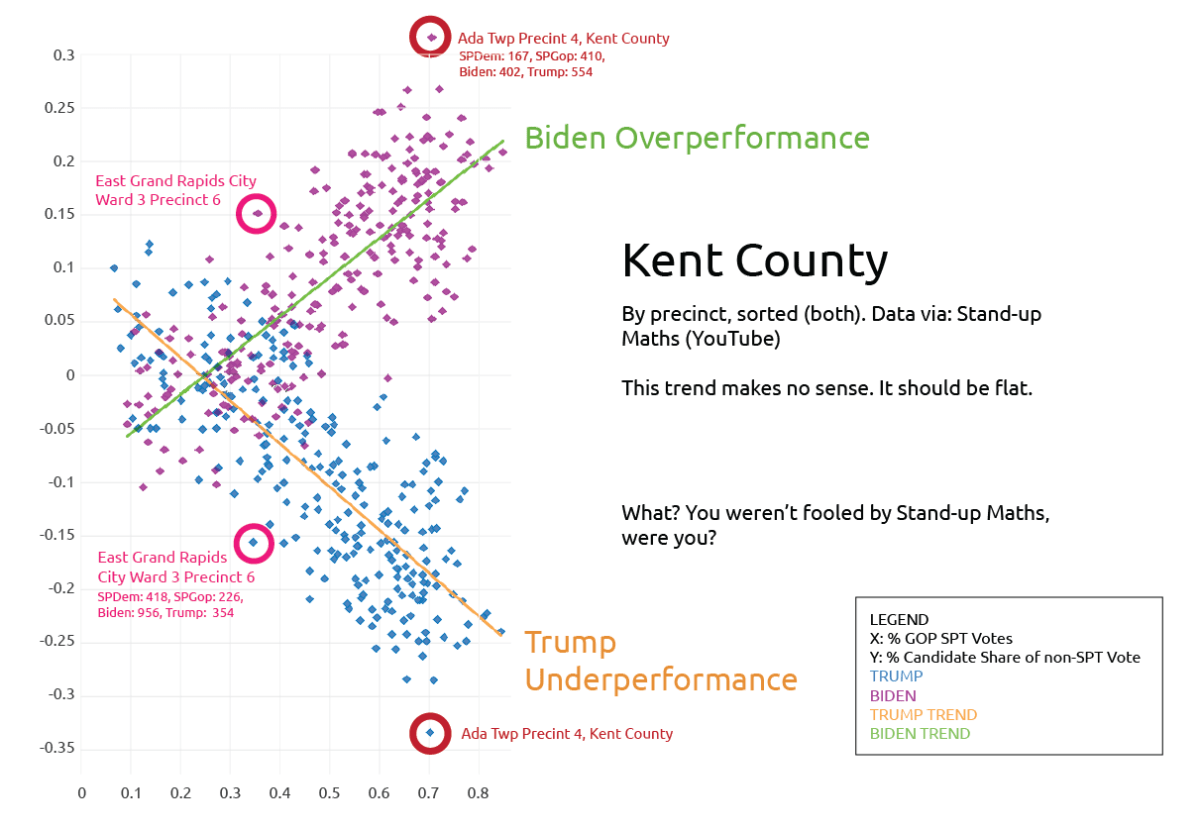
I regenerated the graphs featured in “Do these scatter plots reveal fraudulent vote-switching in Michigan?” (only this time, un-reversing the x-axis so individual precincts line up). In this case, the x-axis (for both plots) is % STGop.
I can’t intuit any reason this shouldn’t be flat or a meaningless blob.
This. Trend. Is. Super. Weird.
Why?
Because the algorithm wasn’t programed to flip Straight Party ticket votes (which only 6 states do), only individual candidate votes. Duh.